Introduction:
Producing accurate volume measurements of materials is important in many applications today. For example, inventory and management of stockpiles and pits of mining companies. It is important for companies to keep track of stockpile material inventory. Traditional methods of gathering volume information can be risky as piles can be larger, difficult to traverse, and non-uniform in shape making calculation difficult and can take a long time to get results. Three major areas of error exist in calculating stockpile volume according to Firmatek, an inventory management company: “poorly defined base”, “insufficient data on top of the stockpile”, and “including extra material”. Today, “fly-over” methods using photogrammetry collected by Unmanned Aerial Systems (UAS) can be used for high accuracy and speedy results.
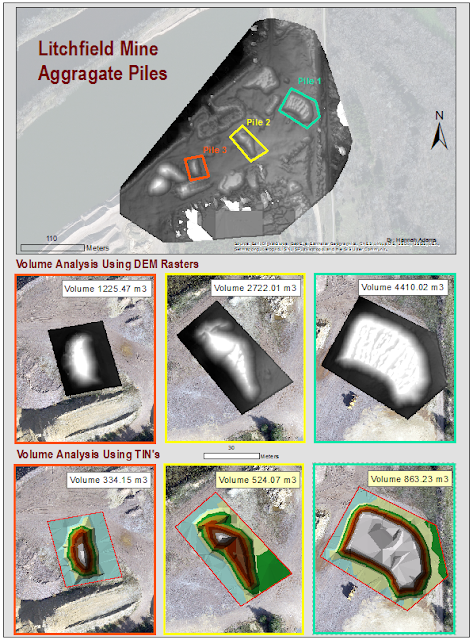
Volumetric analysis is used to find volume in different programs depending on the type of data. For instance, DEM and TIN files can be used to calculate volume in ArcMap and photogrammetric images can be processed in Pix4D. Accurate volume measurements are necessary in today’s world as we move towards responsible tracking of material. In this lab volumes of stockpiles at the Litchfield mine will be calculated. This lab will compare the advantages and disadvantages of three methods used to calculate volume.
Methods:
Calculating Volume with DEM in ArcMap:
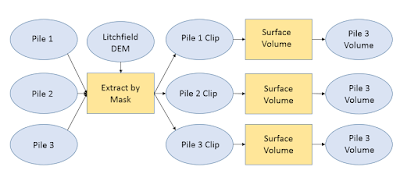
With this method a DEM of the study area was imported into ArcMap. From here, individual aggregate piles were chosen and clipped by making polygons to be used for the Extract by Mask tool. After each pile was clipped (Fig. 1) the identify tool was used to get a sense of elevation at the base of the pile. This information is crucial to calculate volume but in this case we have to estimate the average height around each pile. Then the Surface Volume tool (Fig. 2) was used and the to enter the estimated base elevation into the Plane Height field to calculate the volume in the raster above that elevation. This information was then added to an output text file. This can all be seen in the workflow below (Fig. 3).
 |
| Fig. 1: To the left is the Litchfield Mine DEM raster with the corresponding polygons used in the Extract by mask tool. To the right are the out put clipped rasters. |
 |
| Fig. 2: Here is the Surface Volume tool window. When using this tool make sure the Reference Plane is set to "ABOVE" when calculating for a pile. |
 |
| Fig. 3: Here is the workflow for calculating the volume of piles on the Litchfield Mine Site. |
Calculating Volume with TIN in ArcMap:
For this method the raster clips produced in the previous method were used and converted into TINs using the Raster to TIN tool in ArcMap. After this was done a polygon was created to outline the "base" of the pile (Fig. 4). Next, the Add Surface Information tool was used to assign a Z_MEAN value in the attribute table of the polygon. This is done by entering the ploygon as the Input Feature Class and the Tin as the Input Surface . Now the volume can be calculated using the Polygon Volume tool. The Input Feature Class is the polygon but there is an additional field, Height Field, where the Z_MEAN field is entered (Fig. 5). After this the Volume value for the pile is attatched in the polygon's attribute table. Repeat these steps for each pile you wish to calculate the volume using a TIN (Fig. 6).
For this method the raster clips produced in the previous method were used and converted into TINs using the Raster to TIN tool in ArcMap. After this was done a polygon was created to outline the "base" of the pile (Fig. 4). Next, the Add Surface Information tool was used to assign a Z_MEAN value in the attribute table of the polygon. This is done by entering the ploygon as the Input Feature Class and the Tin as the Input Surface . Now the volume can be calculated using the Polygon Volume tool. The Input Feature Class is the polygon but there is an additional field, Height Field, where the Z_MEAN field is entered (Fig. 5). After this the Volume value for the pile is attatched in the polygon's attribute table. Repeat these steps for each pile you wish to calculate the volume using a TIN (Fig. 6).
 |
| Figure 4: On the left is the TIN for pile two after the Raster to TIN tool was used. The right image illustrates the polygon that was made to represent the base of the pile. |
 |
| Figure 5. The final step for calculating the volume of an aggregate TIN pile. |
 |
| Figure 6: A workflow for calculating the volume of TIN's. |
Calculating Volume with Pix4D:
To calculate a volume measurement in Pix4D right click objects in the rayCloud tab and select new volume. From here, click at the base of a pile to add a vertices and complete an outline of the base by right clicking. On the left hand side of the screen a window will appear, click the "update measurements" button to calculate the volume. After the Volume is calculate the pile will turn red as shown in Figure 7.
To calculate a volume measurement in Pix4D right click objects in the rayCloud tab and select new volume. From here, click at the base of a pile to add a vertices and complete an outline of the base by right clicking. On the left hand side of the screen a window will appear, click the "update measurements" button to calculate the volume. After the Volume is calculate the pile will turn red as shown in Figure 7.
Results:
Conclusion:


No comments:
Post a Comment